简介
Prometheus Operator 是 CoreOS 开发的基于 Prometheus 的 Kubernete s监控方案,也可能是目前功能最全面的开源方案。更多信息可以查看https://github.com/coreos/prometheus-operator
部署 Prometheus Operator
前期准备
1. 创建命名空间
为方便管理,创建一个单独的 Namespace monitoring,Prometheus Operator 相关的组件都会部署到这个 Namespace。
1
|
# kubectl create namespace monitoring
|
2. 导入相关镜像
所有节点上面导入 prometheus-operator.tar,下载地址:prometheus-operator.tar
1
|
# docker load -i prometheus-operator.tar
|
安装 Prometheus Operator
1. 使用 Helm 安装 Prometheus Operator
Prometheus Operator 所有的组件都打包成 Helm Chart,安装部署非常方便。
1
|
# helm install --name prometheus-operator --namespace=monitoring stable/prometheus-operator
|
2. 查看创建的资源
 1
 2
 3
 4
 5
 6
 7
 8
 9
10
11
12
13
14
15
16
17
18
19
20
21
22
23
24
25
26
27
28
29
30
31
32
33
34
35
36
37
|
# kubectl get all -n monitoring
NAME                                                          READY   STATUS    RESTARTS   AGE
pod/alertmanager-prometheus-operator-alertmanager-0           2/2     Running   0          60s
pod/prometheus-operator-grafana-6c8f4bcfb4-jp5bh              3/3     Running   0          65s
pod/prometheus-operator-kube-state-metrics-6b6d6b8bbd-gff7j   1/1     Running   0          65s
pod/prometheus-operator-operator-76f78fd685-295rb             1/1     Running   0          65s
pod/prometheus-operator-prometheus-node-exporter-44tgz        1/1     Running   0          65s
pod/prometheus-operator-prometheus-node-exporter-6t4sc        1/1     Running   0          65s
pod/prometheus-operator-prometheus-node-exporter-vnwrv        1/1     Running   0          65s
pod/prometheus-prometheus-operator-prometheus-0               3/3     Running   1          54s

NAME                                                   TYPE        CLUSTER-IP       EXTERNAL-IP   PORT(S)             AGE
service/alertmanager-operated                          ClusterIP   None             <none>        9093/TCP,6783/TCP   60s
service/prometheus-operated                            ClusterIP   None             <none>        9090/TCP            54s
service/prometheus-operator-alertmanager               ClusterIP   10.105.62.219    <none>        9093/TCP            65s
service/prometheus-operator-grafana                    ClusterIP   10.103.30.59     <none>        80/TCP              65s
service/prometheus-operator-kube-state-metrics         ClusterIP   10.105.189.63    <none>        8080/TCP            65s
service/prometheus-operator-operator                   ClusterIP   10.105.212.90    <none>        8080/TCP            65s
service/prometheus-operator-prometheus                 ClusterIP   10.104.229.158   <none>        9090/TCP            65s
service/prometheus-operator-prometheus-node-exporter   ClusterIP   10.103.226.249   <none>        9100/TCP            65s

NAME                                                          DESIRED   CURRENT   READY   UP-TO-DATE   AVAILABLE   NODE SELECTOR   AGE
daemonset.apps/prometheus-operator-prometheus-node-exporter   3         3         3       3            3           <none>          65s

NAME                                                     READY   UP-TO-DATE   AVAILABLE   AGE
deployment.apps/prometheus-operator-grafana              1/1     1            1           65s
deployment.apps/prometheus-operator-kube-state-metrics   1/1     1            1           65s
deployment.apps/prometheus-operator-operator             1/1     1            1           65s

NAME                                                                DESIRED   CURRENT   READY   AGE
replicaset.apps/prometheus-operator-grafana-6c8f4bcfb4              1         1         1       65s
replicaset.apps/prometheus-operator-kube-state-metrics-6b6d6b8bbd   1         1         1       65s
replicaset.apps/prometheus-operator-operator-76f78fd685             1         1         1       65s

NAME                                                             READY   AGE
statefulset.apps/alertmanager-prometheus-operator-alertmanager   1/1     60s
statefulset.apps/prometheus-prometheus-operator-prometheus       1/1     54s
|
3.查看安装后的 release
1
2
3
|
# helm list
NAME               	REVISION	UPDATED                 	STATUS  	CHART                    	APP VERSION	NAMESPACE
prometheus-operator	1       	Tue Jan  8 13:49:12 2019	DEPLOYED	prometheus-operator-1.5.1	0.26.0     	monitoring
|
prometheus-operator 的 charts 会自动安装 Prometheus、Alertmanager 和 Grafana。
修改访问模式
1. 查看访问类型
 1
 2
 3
 4
 5
 6
 7
 8
 9
10
|
# kubectl get svc -n monitoring
NAME                                           TYPE        CLUSTER-IP       EXTERNAL-IP   PORT(S)             AGE
alertmanager-operated                          ClusterIP   None             <none>        9093/TCP,6783/TCP   7m30s
prometheus-operated                            ClusterIP   None             <none>        9090/TCP            7m24s
prometheus-operator-alertmanager               ClusterIP   10.105.62.219    <none>        9093/TCP            7m35s
prometheus-operator-grafana                    ClusterIP   10.103.30.59     <none>        80/TCP              7m35s
prometheus-operator-kube-state-metrics         ClusterIP   10.105.189.63    <none>        8080/TCP            7m35s
prometheus-operator-operator                   ClusterIP   10.105.212.90    <none>        8080/TCP            7m35s
prometheus-operator-prometheus                 ClusterIP   10.104.229.158   <none>        9090/TCP            7m35s
prometheus-operator-prometheus-node-exporter   ClusterIP   10.103.226.249   <none>        9100/TCP            7m35s
|
默认的访问类型为 ClusterIP 无法外部访问,只能集群内访问。
2. 修改 alertmanager、prometheus、grafana的访问类型
grafana:
 1
 2
 3
 4
 5
 6
 7
 8
 9
10
11
12
13
14
15
|
# kubectl edit svc prometheus-operator-grafana -n monitoring

……
spec:
  clusterIP: 10.103.30.59
  ports:
  - name: service
    port: 80
    protocol: TCP
    targetPort: 3000
  selector:
    app: grafana
    release: prometheus-operator
  sessionAffinity: None
  type: NodePort        #修改此行
|
alertmanager:
 1
 2
 3
 4
 5
 6
 7
 8
 9
10
11
12
13
14
15
16
17
|
# kubectl edit svc prometheus-operator-alertmanager -n monitoring

……
spec:
  clusterIP: 10.105.62.219
  ports:
  - name: web
    port: 9093
    protocol: TCP
    targetPort: 9093
  selector:
    alertmanager: prometheus-operator-alertmanager
    app: alertmanager
  sessionAffinity: None
  type: NodePort       #修改此行
status:
  loadBalancer: {}
|
prometheus:
 1
 2
 3
 4
 5
 6
 7
 8
 9
10
11
12
13
14
15
16
17
|
# kubectl edit svc prometheus-operator-prometheus -n monitoring

……
spec:
  clusterIP: 10.104.229.158
  ports:
  - name: web
    port: 9090
    protocol: TCP
    targetPort: web
  selector:
    app: prometheus
    prometheus: prometheus-operator-prometheus
  sessionAffinity: None
  type: NodePort      #修改此行
status:
  loadBalancer: {}
|
3. 查看修改后的访问类型
 1
 2
 3
 4
 5
 6
 7
 8
 9
10
|
# kubectl get svc -n monitoring
NAME                                           TYPE        CLUSTER-IP       EXTERNAL-IP   PORT(S)             AGE
alertmanager-operated                          ClusterIP   None             <none>        9093/TCP,6783/TCP   23m
prometheus-operated                            ClusterIP   None             <none>        9090/TCP            23m
prometheus-operator-alertmanager               NodePort    10.105.62.219    <none>        9093:32645/TCP      23m
prometheus-operator-grafana                    NodePort    10.103.30.59     <none>        80:30043/TCP        23m
prometheus-operator-kube-state-metrics         ClusterIP   10.105.189.63    <none>        8080/TCP            23m
prometheus-operator-operator                   ClusterIP   10.105.212.90    <none>        8080/TCP            23m
prometheus-operator-prometheus                 NodePort    10.104.229.158   <none>        9090:32275/TCP      23m
prometheus-operator-prometheus-node-exporter   ClusterIP   10.103.226.249   <none>        9100/TCP            23m
|
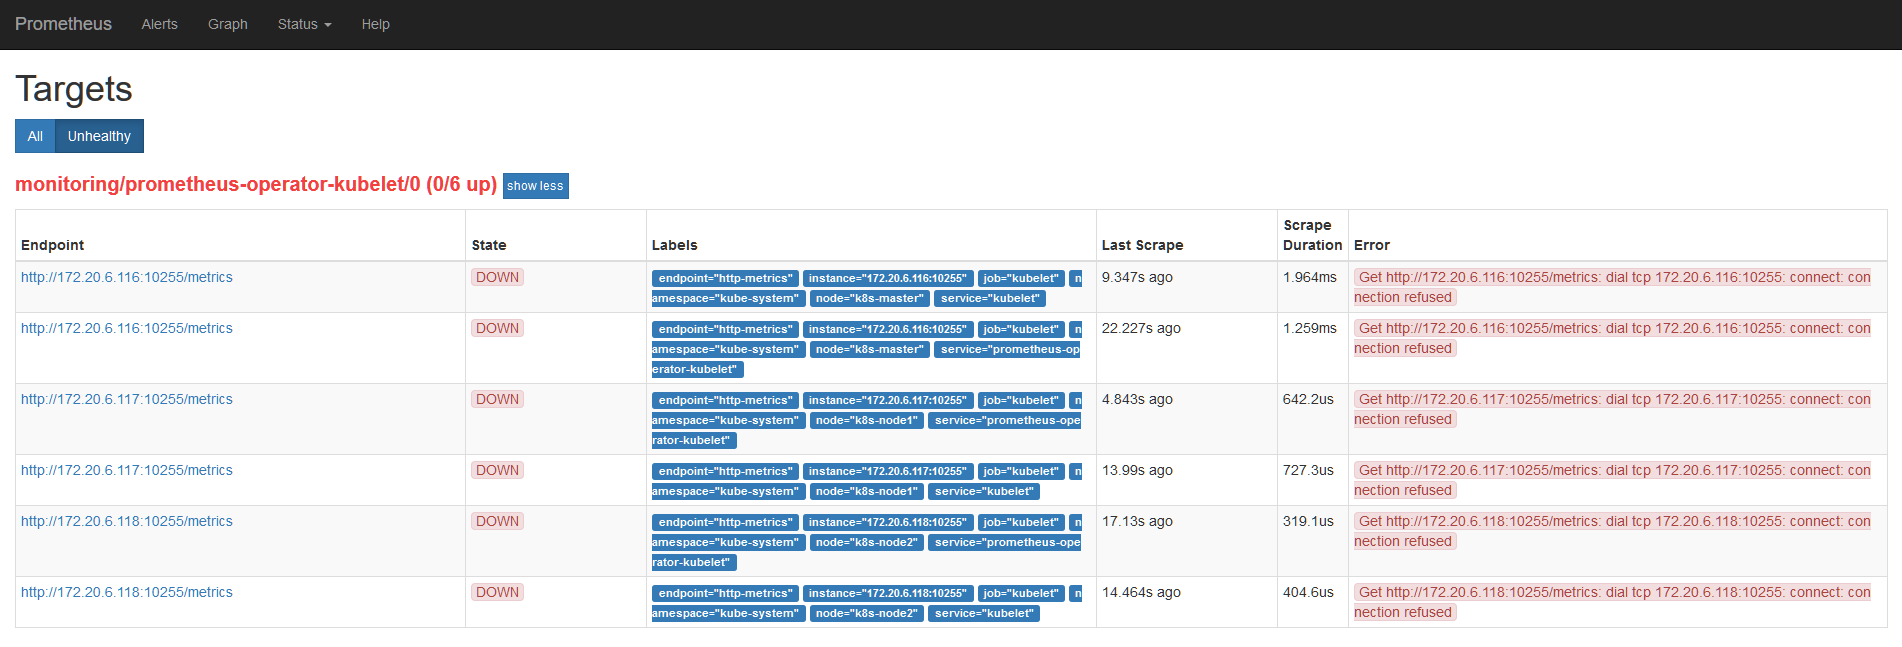
修改 kubelet 打开只读端口
prometheus 需要访问 kubelet 的 10255 端口获取 metrics。但是默认情况下 10255 端口是不开放的,会导致 prometheus 上有 unhealthy,如下图:
 打开只读端口需要编辑所有节点的 /var/lib/kubelet/config.yaml 文件,加入以下内容
 1
 2
 3
 4
 5
 6
 7
 8
 9
10
|
# /var/lib/kubelet/config.yaml

……
oomScoreAdj: -999
podPidsLimit: -1
port: 10250
readOnlyPort: 10255          #增加此行
registryBurst: 10
registryPullQPS: 5
resolvConf: /etc/resolv.conf
|
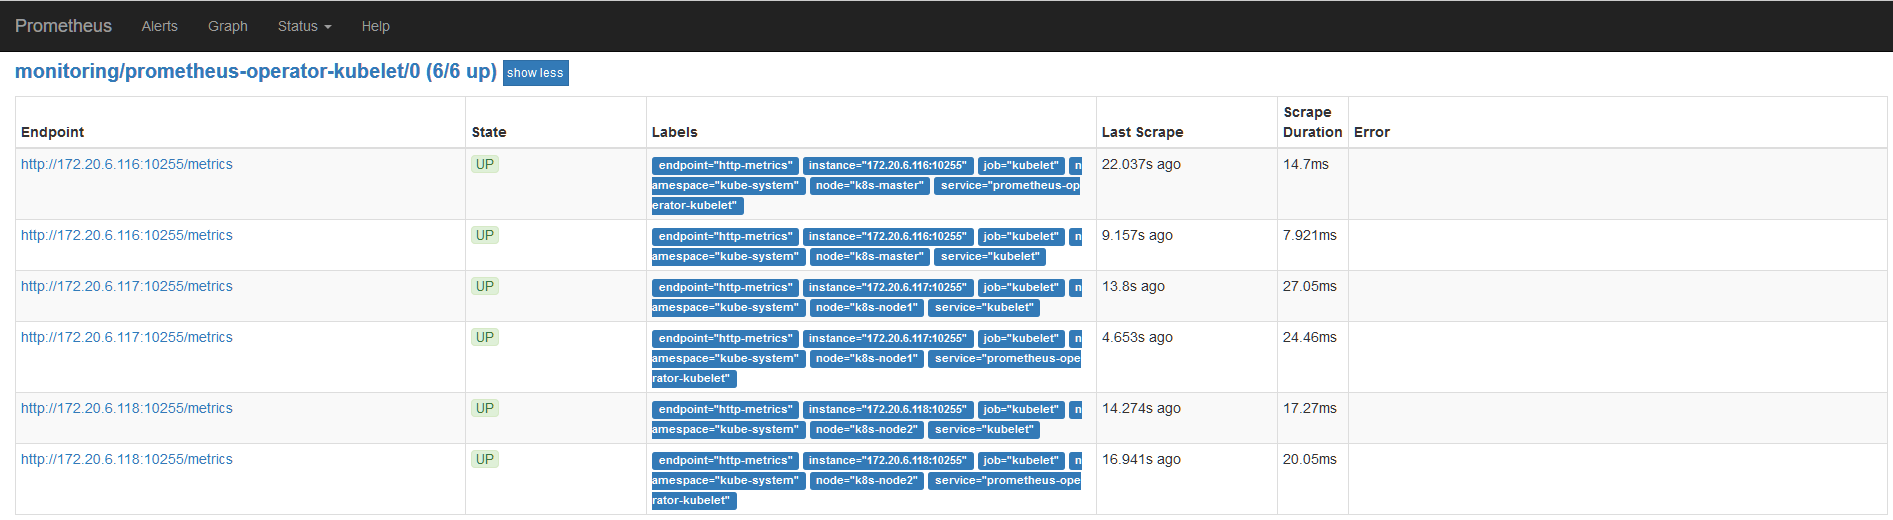
重启 kubelet 服务
1
|
# systemctl restart kubelet.service
|
查看 prometheus target
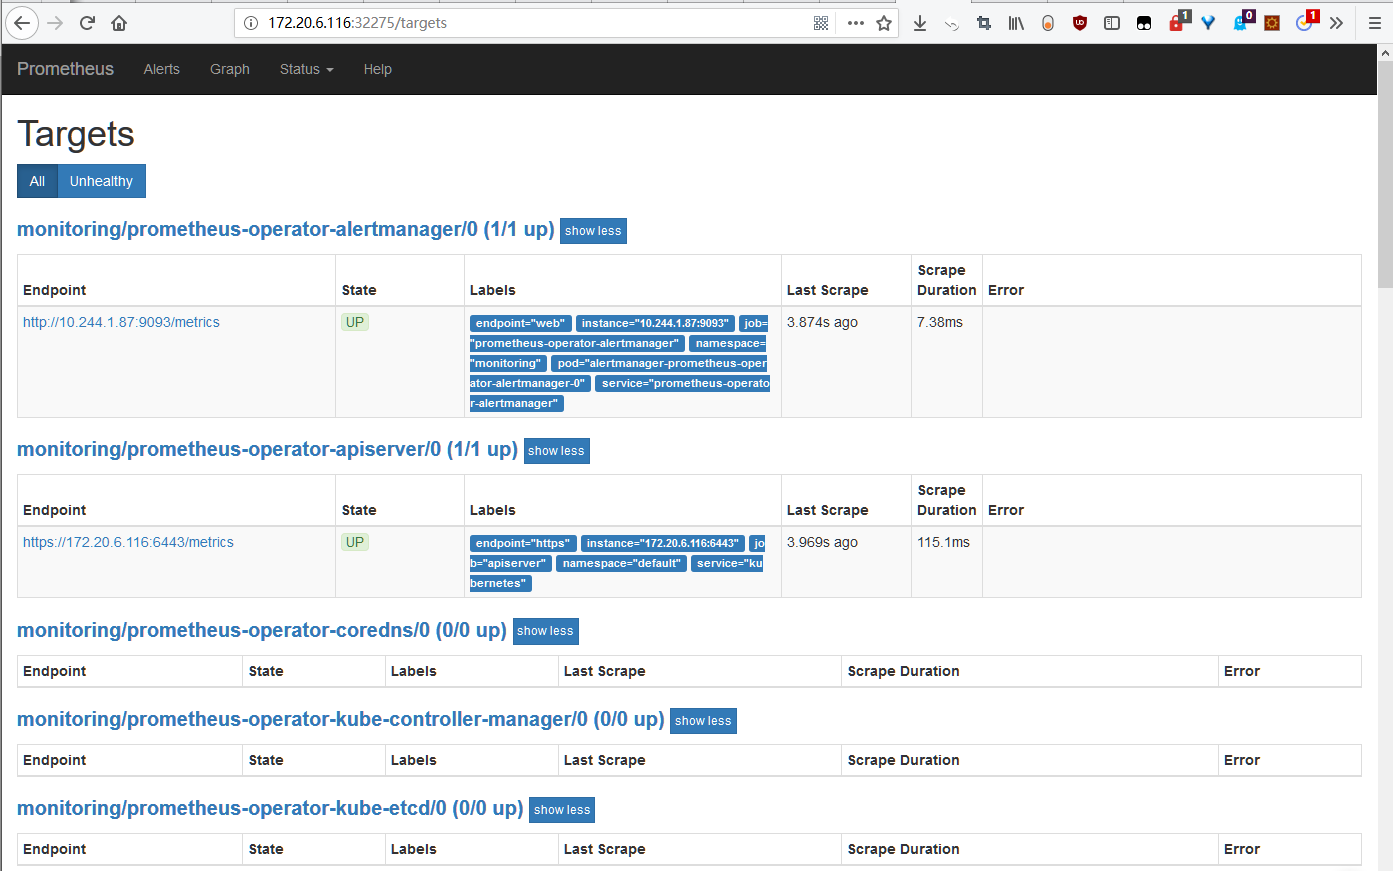
访问 dashboard
-
Pormetheus 的 Web UI
访问地址为:http://nodeip:32275/target,如下图:
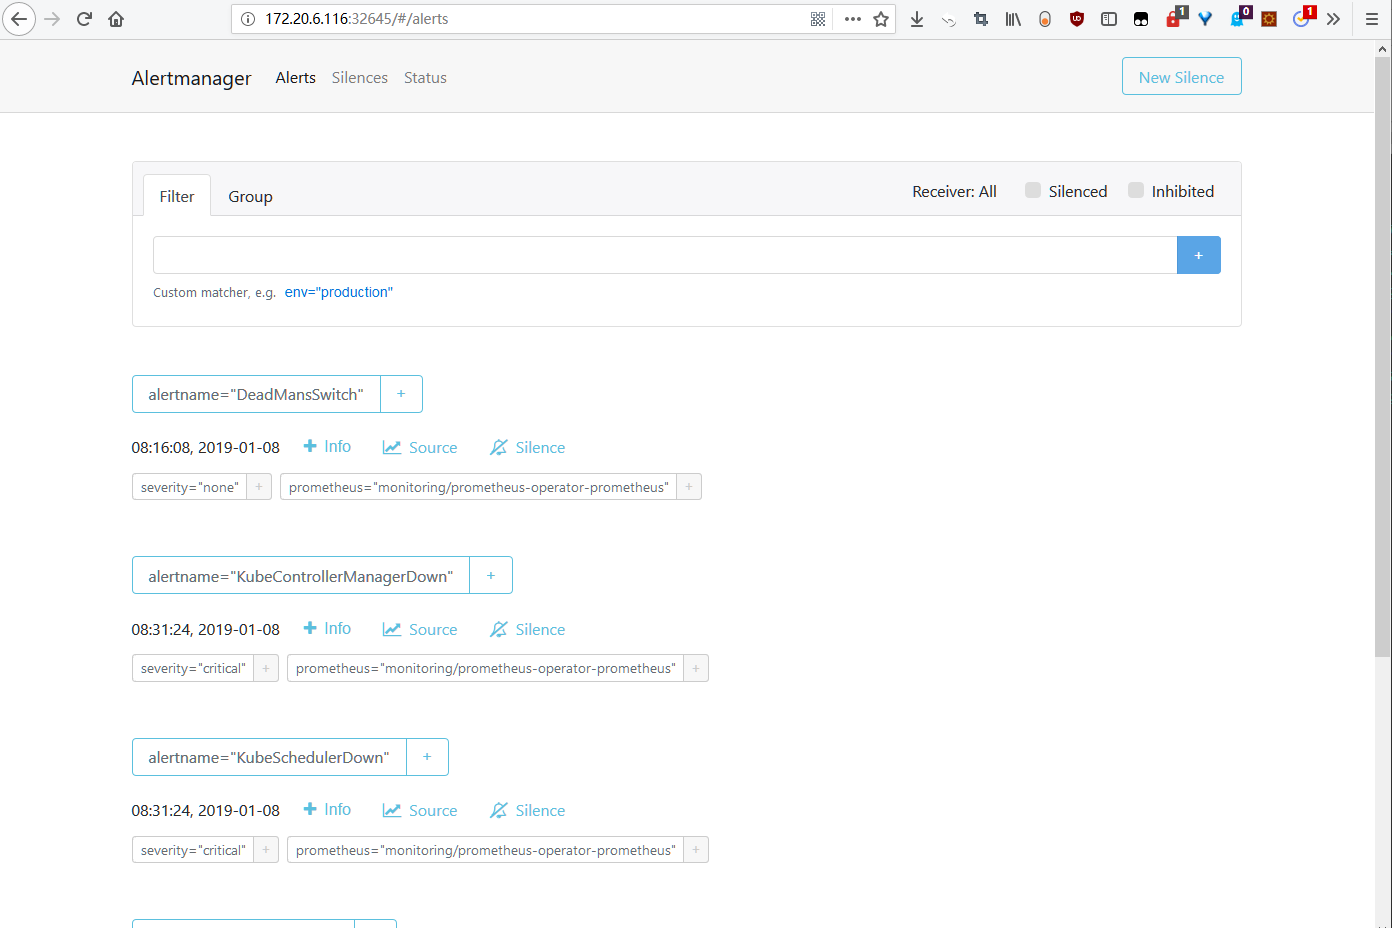
-
Alertmanager 的 Web UI
访问地址为:http://nodeip:32645/,如下图:
-
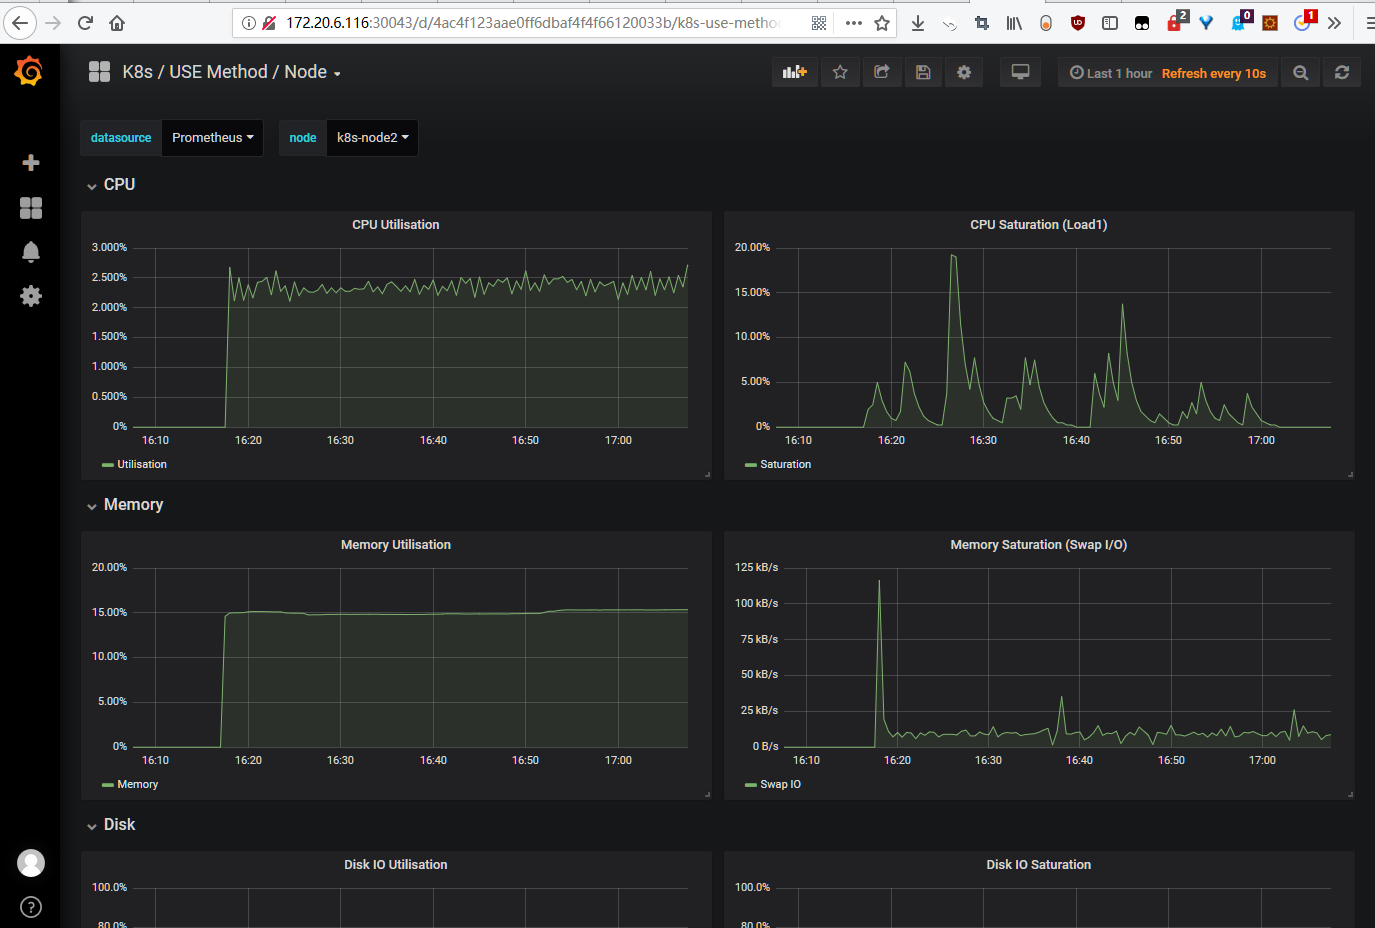
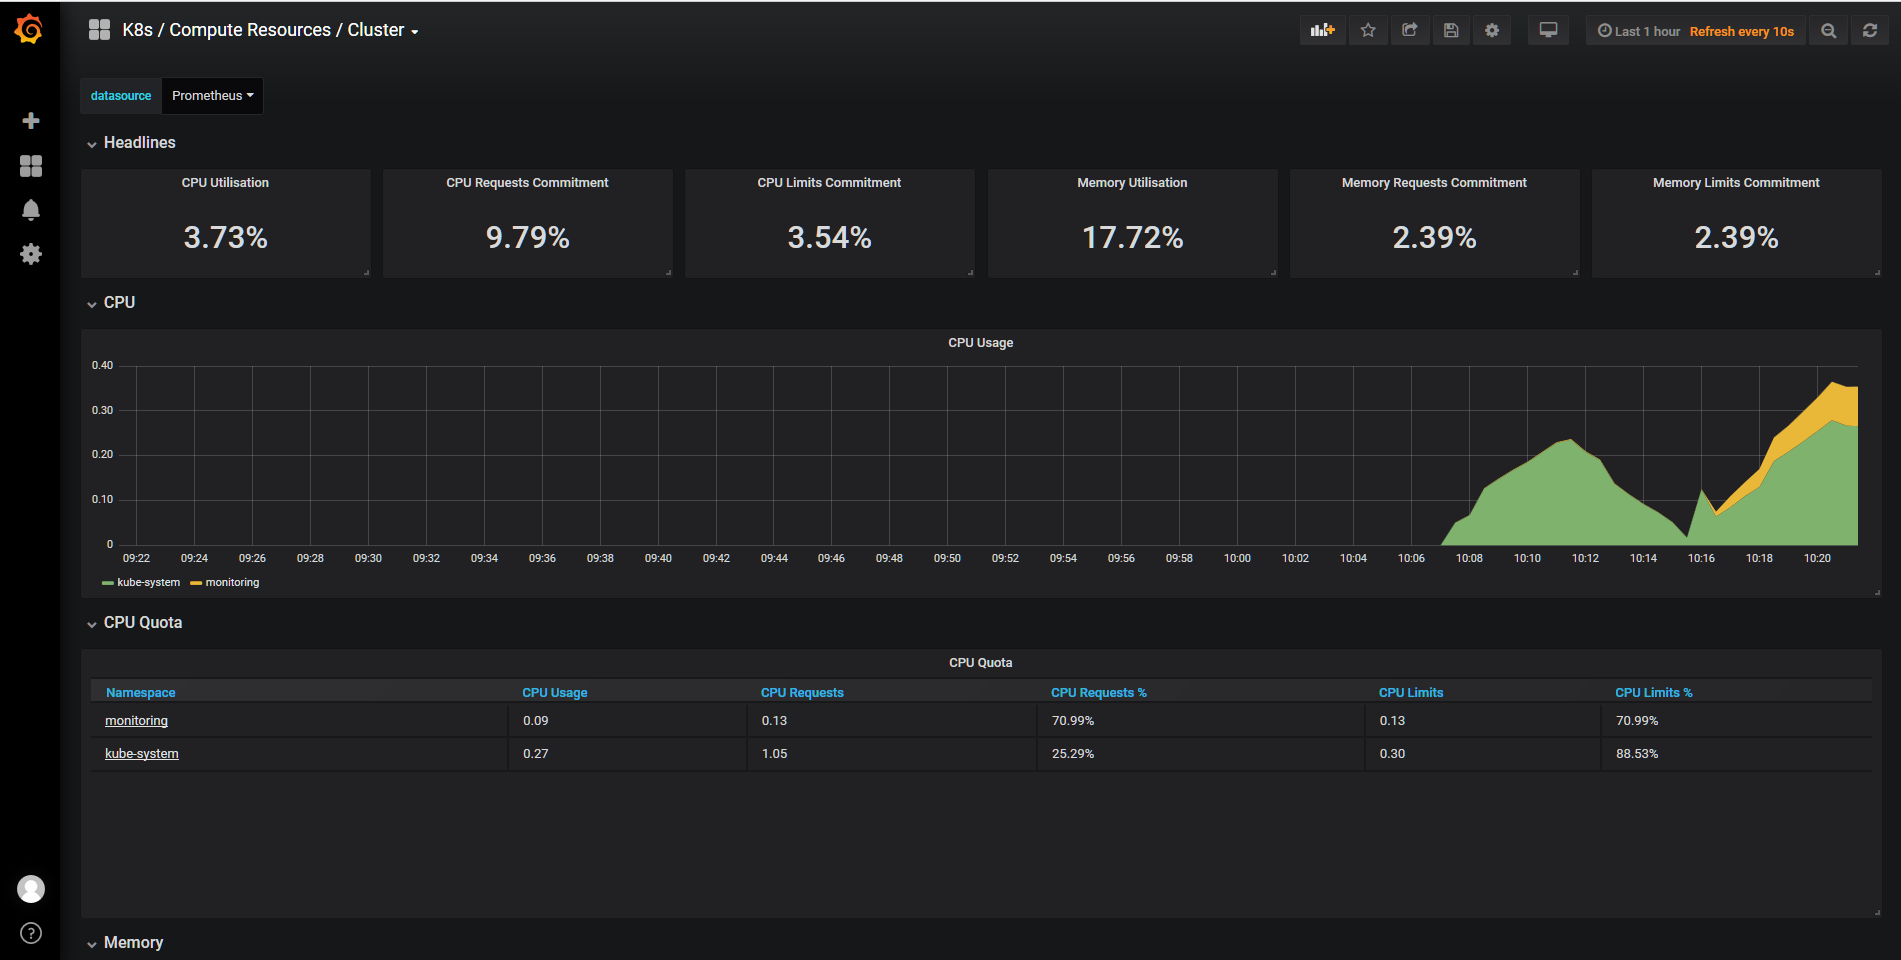
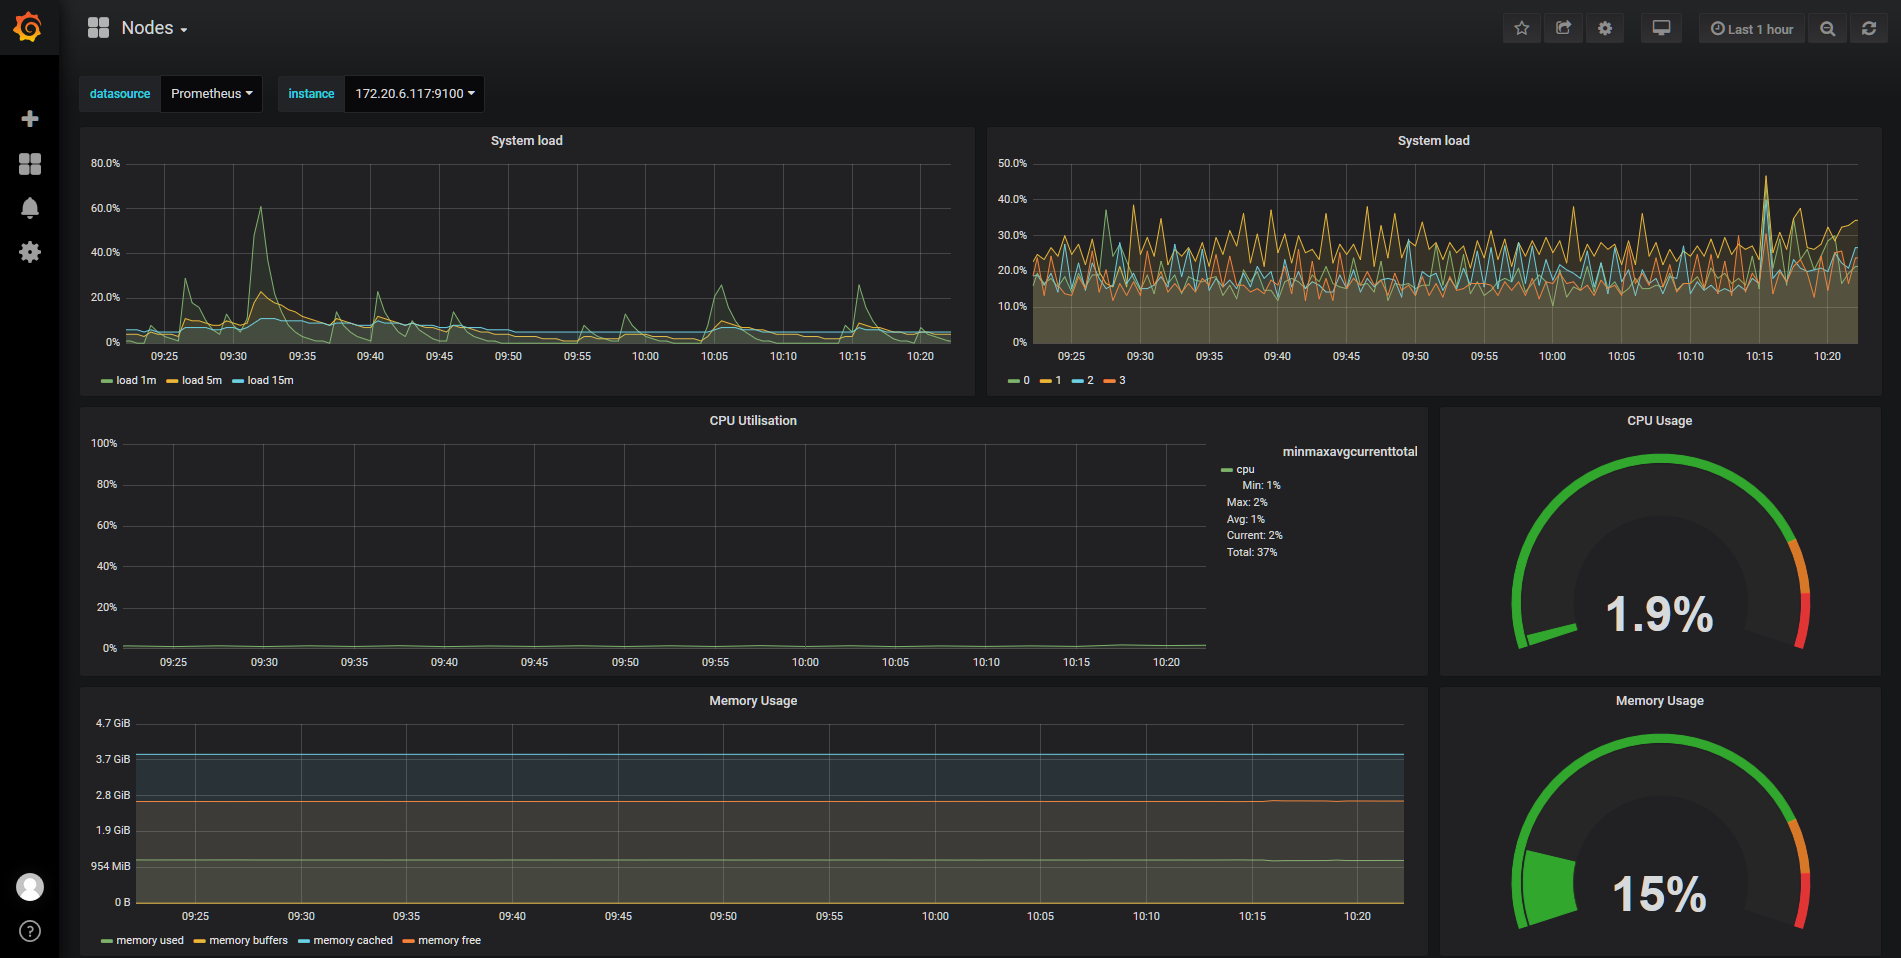
Grafana Dashboard
访问地址为:http://nodeip:30043/,默认的用户名/密码为:admin/prom-operator,登陆后如下图:
问题记录
1. prometheus-operator-coredns 无数据
问题详情见:Don’t scrape metrics from coreDNS
解决方法如下:修改 prometheus-operator-coredns 服务的 selector 为 kube-dns
 1
 2
 3
 4
 5
 6
 7
 8
 9
10
11
12
13
14
|
# kubectl edit svc prometheus-operator-coredns  -n kube-system

……
spec:
  clusterIP: None
  ports:
  - name: http-metrics
    port: 9153
    protocol: TCP
    targetPort: 9153
  selector:
    k8s-app: kube-dns         #修改此行
  sessionAffinity: None
  type: ClusterIP
|
2. prometheus-operator-kube-etcd 无数据
prometheus 通过 4001 端口访问 etcd metrics,但是 etcd 默认监听 2379。
解决方法如下:
 1
 2
 3
 4
 5
 6
 7
 8
 9
10
11
12
13
14
15
16
17
18
19
20
21
22
23
24
25
26
27
28
29
30
31
32
33
34
|
# vim /etc/slug:/manifests/etcd.yaml

apiVersion: v1
kind: Pod
metadata:
  annotations:
    scheduler.alpha.slug:.io/critical-pod: ""
  creationTimestamp: null
  labels:
    k8s-app: etcd-server                                                       #增加此行
    component: etcd
    tier: control-plane
  name: etcd
  namespace: kube-system
spec:
  containers:
  - command:
    - etcd
    - --advertise-client-urls=https://172.20.6.116:2379
    - --cert-file=/etc/slug:/pki/etcd/server.crt
    - --client-cert-auth=true
    - --data-dir=/var/lib/etcd
    - --initial-advertise-peer-urls=https://172.20.6.116:2380
    - --initial-cluster=k8s-master=https://172.20.6.116:2380
    - --key-file=/etc/slug:/pki/etcd/server.key
    - --listen-client-urls=https://127.0.0.1:2379,https://172.20.6.116:2379,http://172.20.6.116:4001         #增加 4001 端口的 http 监听
    - --listen-peer-urls=https://172.20.6.116:2380
    - --name=k8s-master
    - --peer-cert-file=/etc/slug:/pki/etcd/peer.crt
    - --peer-client-cert-auth=true
    - --peer-key-file=/etc/slug:/pki/etcd/peer.key
    - --peer-trusted-ca-file=/etc/slug:/pki/etcd/ca.crt
    - --snapshot-count=10000
    - --trusted-ca-file=/etc/slug:/pki/etcd/ca.crt
|
重启 kubelet 服务即可
1
|
# systemctl restart kubelet.service
|
3. prometheus-operator-kube-controller-manager 和 prometheus-operator-kube-scheduler 无数据
由于 kube-controller-manager 和 kube-scheduler 默认监听 127.0.0.1 ,prometheus 无法通过本机地址获取数据,需要修改kube-controller-manager 和 kube-scheduler 监听地址。
解决办法如下:
kube-controller-manager:
 1
 2
 3
 4
 5
 6
 7
 8
 9
10
11
12
13
14
15
16
17
18
19
20
|
# vim /etc/slug:/manifests/kube-controller-manager.yaml

apiVersion: v1
kind: Pod
metadata:
  annotations:
    scheduler.alpha.slug:.io/critical-pod: ""
  creationTimestamp: null
  labels:
    k8s-app: kube-controller-manager               #增加此行
    component: kube-controller-manager
    tier: control-plane
  name: kube-controller-manager
  namespace: kube-system
spec:
  containers:
  - command:
    - kube-controller-manager
    - --address=0.0.0.0                                   #修改监听地址
    - --allocate-node-cidrs=true
|
kube-scheduler:
 1
 2
 3
 4
 5
 6
 7
 8
 9
10
11
12
13
14
15
16
17
18
19
20
21
|
# vim /etc/slug:/manifests/kube-scheduler.yaml

apiVersion: v1
kind: Pod
metadata:
  annotations:
    scheduler.alpha.slug:.io/critical-pod: ""
  creationTimestamp: null
  labels:
    k8s-app: kube-scheduler                         #增加此行
    component: kube-scheduler
    tier: control-plane
  name: kube-scheduler
  namespace: kube-system
spec:
  containers:
  - command:
    - kube-scheduler
    - --address=0.0.0.0                                   #修改监听地址
    - --kubeconfig=/etc/slug:/scheduler.conf
    - --leader-elect=true
|
重启 kubelet 服务即可
1
|
# systemctl restart kubelet.service
|