一、关于 Calico Felix, Typha 和 kube-controllers 组件
Felix 是一个守护进程,运行在每台机器上实现网络策略等功能,Felix 是 calico 的大脑。
Typha 是一组可选的 pod,可扩展 Felix 以扩展 Calico 节点和数据存储之间的流量。
kube-controllers pod 运行一组控制器,这些控制器负责各种控制平面功能,例如资源垃圾收集和与 Kubernetes API 的同步。
二、 配置 calico 允许 metrics 上报
1. Felix 配置
Felix prometheus metrics 默认是禁用的,需要手动更改 Felix 的配置(prometheusMetricsEnabled)
1
2
|
# kubectl patch felixConfiguration default  --patch '{"spec":{"prometheusMetricsEnabled": true}}' --type=merge
felixconfiguration.crd.projectcalico.org/default patched
|
确认变更成功:
1
2
3
4
5
6
7
|
# kubectl get felixConfiguration default -o yaml
……
spec:
  bpfLogLevel: ""
  logSeverityScreen: Info
  prometheusMetricsEnabled: true         #prometheusMetricsEnabled 是 true
  reportingInterval: 0s
|
2. 创建 service 暴露 Felix metrics
Prometheus 使用 Kubernetes 服务动态发现 endpoint,创建一个名为 felix-metrics-svc 的服务,让 Prometheus 去发现所有的 Felix metrics endpoints。
Felix 默认使用 9091 TCP 上报他的 metrics
 1
 2
 3
 4
 5
 6
 7
 8
 9
10
11
12
13
14
15
16
|
# kubectl apply -f - <<EOF
apiVersion: v1
kind: Service
metadata:
  labels:
    k8s-app: calico-felix-metrics
  name: calico-felix-metrics
  namespace: calico-system
spec:
  selector:
    k8s-app: calico-node
  ports:
  - port: 9091
    targetPort: 9091
    name: felix-metrics
EOF
|
3. Typha 配置
确认在集群中使用了 Typha
1
2
3
4
|
# kubectl get pods -A | grep typha
calico-system          calico-typha-b4d7d885b-24kpd                             1/1     Running   0          45h
calico-system          calico-typha-b4d7d885b-pdb5k                             1/1     Running   0          45h
calico-system          calico-typha-b4d7d885b-rqqcd                             1/1     Running   1          2d16h
|
Typha 没有对应的 crd, PrometheusMetricsEnabled 需要在 custom-resources.yml 中加入typhaMetricsPort 选项
 1
 2
 3
 4
 5
 6
 7
 8
 9
10
11
12
13
14
15
16
17
18
19
20
21
22
23
24
25
26
27
28
29
30
31
|
# vim custom-resources.yml

# This section includes base Calico installation configuration.
# For more information, see: https://docs.projectcalico.org/v3.21/reference/installation/api#operator.tigera.io/v1.Installation
apiVersion: operator.tigera.io/v1
kind: Installation
metadata:
  name: default
spec:
  # Configures Calico networking.
  calicoNetwork:
    # Note: The ipPools section cannot be modified post-install.
    ipPools:
    - blockSize: 26
      cidr: 172.248.0.0/16
      encapsulation: None
      natOutgoing: Enabled
      nodeSelector: all()
  registry: xxxxxxxx.local
  imagePath: k8s-image/calico
  nodeMetricsPort: 9091     # 设置 felix prometheusMetricsEnabled=true 端口 9091,也可以通过修改 felixConfiguration 实现
  typhaMetricsPort: 9093    # 设置 typha prometheusMetricsEnabled=true 端口 9093
---

# This section configures the Calico API server.
# For more information, see: https://docs.projectcalico.org/v3.21/reference/installation/api#operator.tigera.io/v1.APIServer
apiVersion: operator.tigera.io/v1
kind: APIServer
metadata:
  name: default
spec: {}
|
重新应用
1
|
kubectl apply -f custom-resources.yml
|
4. 创建 service 暴露 Typha metrics
 1
 2
 3
 4
 5
 6
 7
 8
 9
10
11
12
13
14
15
16
|
# kubectl apply -f - <<EOF
apiVersion: v1
kind: Service
metadata:
  labels:
    k8s-app: calico-typha-metrics
  name: calico-typha-metrics
  namespace: calico-system
spec:
  selector:
    k8s-app: calico-typha
  ports:
  - port: 9093
    targetPort: 9093
    name: typha-metrics
EOF
|
5. kube-controllers 配置
kube-controllers prometheus metrics 默认是启动的,使用 9094 TCP 端口。可以通过修改 KubeControllersConfiguration 资源调整端口。
1
2
|
不修改默认端口无需执行此步骤
# kubectl patch kubecontrollersconfiguration default  --patch '{"spec":{"prometheusMetricsPort": 9095}}'
|
6. 创建 service 暴露 kube-controllers metrics
在calico 的安装中已经默认创建了 kube-controllers metrics 的service,以下步骤可以跳过
 1
 2
 3
 4
 5
 6
 7
 8
 9
10
11
12
13
14
15
16
|
# kubectl apply -f - <<EOF
apiVersion: v1
kind: Service
metadata:
  labels:
    k8s-app: calico-kube-controllers
  name: calico-kube-controllers-metrics
  namespace: calico-system
spec:
  selector:
    k8s-app: calico-kube-controllers
  ports:
  - port: 9094
    targetPort: 9094
    name: kube-controllers-metrics
EOF
|
查看 port name
1
2
3
4
5
6
7
|
# kubectl get svc -n calico-system calico-kube-controllers-metrics -o yaml | grep ports: -A4

  ports:
  - name: metrics-port
    port: 9094
    protocol: TCP
    targetPort: 9094
|
kube-controllers metrics service 的port name 为 metrics-port
三、prometheus 采集指标
1. 创建ServiceMonitor
kube-prometheus-stack在部署时会创建 Prometheus、PodMonitor、ServiceMonitor、AlertManager 和 PrometheusRule 这 5 个 CRD 资源对象,然后会一直监控并维持这 5 个资源对象的状态。
- Prometheus 这个资源对象就是对 Prometheus Server 的抽象。
- PodMonitor 和 ServiceMonitor 就是 exporter 的各种抽象,是用来提供专门提供指标数据接口的工具,
- Prometheus 就是通过 PodMonitor 和 ServiceMonitor 提供的指标数据接口去 pull 数据的。
- ServiceMonitor 要求被监控的服务必须有对应的 Service。
- PodMonitor 虽然不需要应用创建相应的 Service,但必须在 Pod 中指定指标的端口和名称。
我们已经创建了对应的 service,所有使用 ServiceMonitor 来采集指标。使用以下 yaml 创建 ServiceMonitor 。
 1
 2
 3
 4
 5
 6
 7
 8
 9
10
11
12
13
14
15
16
17
18
19
20
21
22
23
24
25
26
27
28
29
30
31
32
33
34
35
36
37
38
39
40
41
42
43
44
45
46
47
48
49
50
51
52
53
54
55
56
57
58
|
# vim prometheus-ServiceMonitorCalico.yaml

apiVersion: monitoring.coreos.com/v1
kind: ServiceMonitor
metadata:
  labels:
    release: prometheus # 必须添加此 label,因为 prometheus 的对象 serviceMonitorSelector 匹配 release: prometheus 的 ServiceMonitor
  name: prometheus-calico-felix-metrics
  namespace: monitoring
spec:
  endpoints:
    - interval: 15s
      path: /metrics
      port: felix-metrics
  namespaceSelector:
    matchNames:
    - calico-system
  selector:
    matchLabels:
      k8s-app: calico-felix-metrics
---
apiVersion: monitoring.coreos.com/v1
kind: ServiceMonitor
metadata:
  labels:
    release: prometheus
  name: prometheus-calico-typha-metrics
  namespace: monitoring
spec:
  endpoints:
    - interval: 15s
      path: /metrics
      port: typha-metrics
  namespaceSelector:
    matchNames:
    - calico-system
  selector:
    matchLabels:
      k8s-app: calico-typha-metrics
---
apiVersion: monitoring.coreos.com/v1
kind: ServiceMonitor
metadata:
  labels:
    release: prometheus
  name: prometheus-calico-kube-controllers-metrics
  namespace: monitoring
spec:
  endpoints:
    - interval: 15s
      path: /metrics
      port: kube-controllers-metrics
  namespaceSelector:
    matchNames:
    - calico-system
  selector:
    matchLabels:
      k8s-app: calico-kube-controllers
|
在这段YAML文件中,各代码段的含义如下:
-
metadata下的name和namespace将指定ServiceMonitor所需的一些关键元信息。
-
spec的endpoints为服务端点,代表Prometheus所需的采集Metrics的地址。endpoints为一个数组,同时可以创建多个endpoints。每个endpoints包含三个字段,每个字段的含义如下:
- interval:指定Prometheus对当前endpoints采集的周期。
- path:指定Prometheus的采集路径。
- port:指定采集数据需要通过的端口,设置的端口为创建Service时端口所设置的name。
-
spec的namespaceSelector为需要发现的Service的范围。namespaceSelector包含两个互斥字段,字段的含义如下:
- any:有且仅有一个值true,当该字段被设置时,将监听所有符合Selector过滤条件的Service的变动。
- matchNames:数组值,指定需要监听的namespace的范围
-
spec的selector用于选择Service。
应用 ServiceMonitor
1
2
3
4
|
# kubectl apply -f prometheus-ServiceMonitorCalico.yaml
servicemonitor.monitoring.coreos.com/felix-metrics created
servicemonitor.monitoring.coreos.com/typha-metrics created
servicemonitor.monitoring.coreos.com/kube-controllers-metrics create
|
2. 检查 target
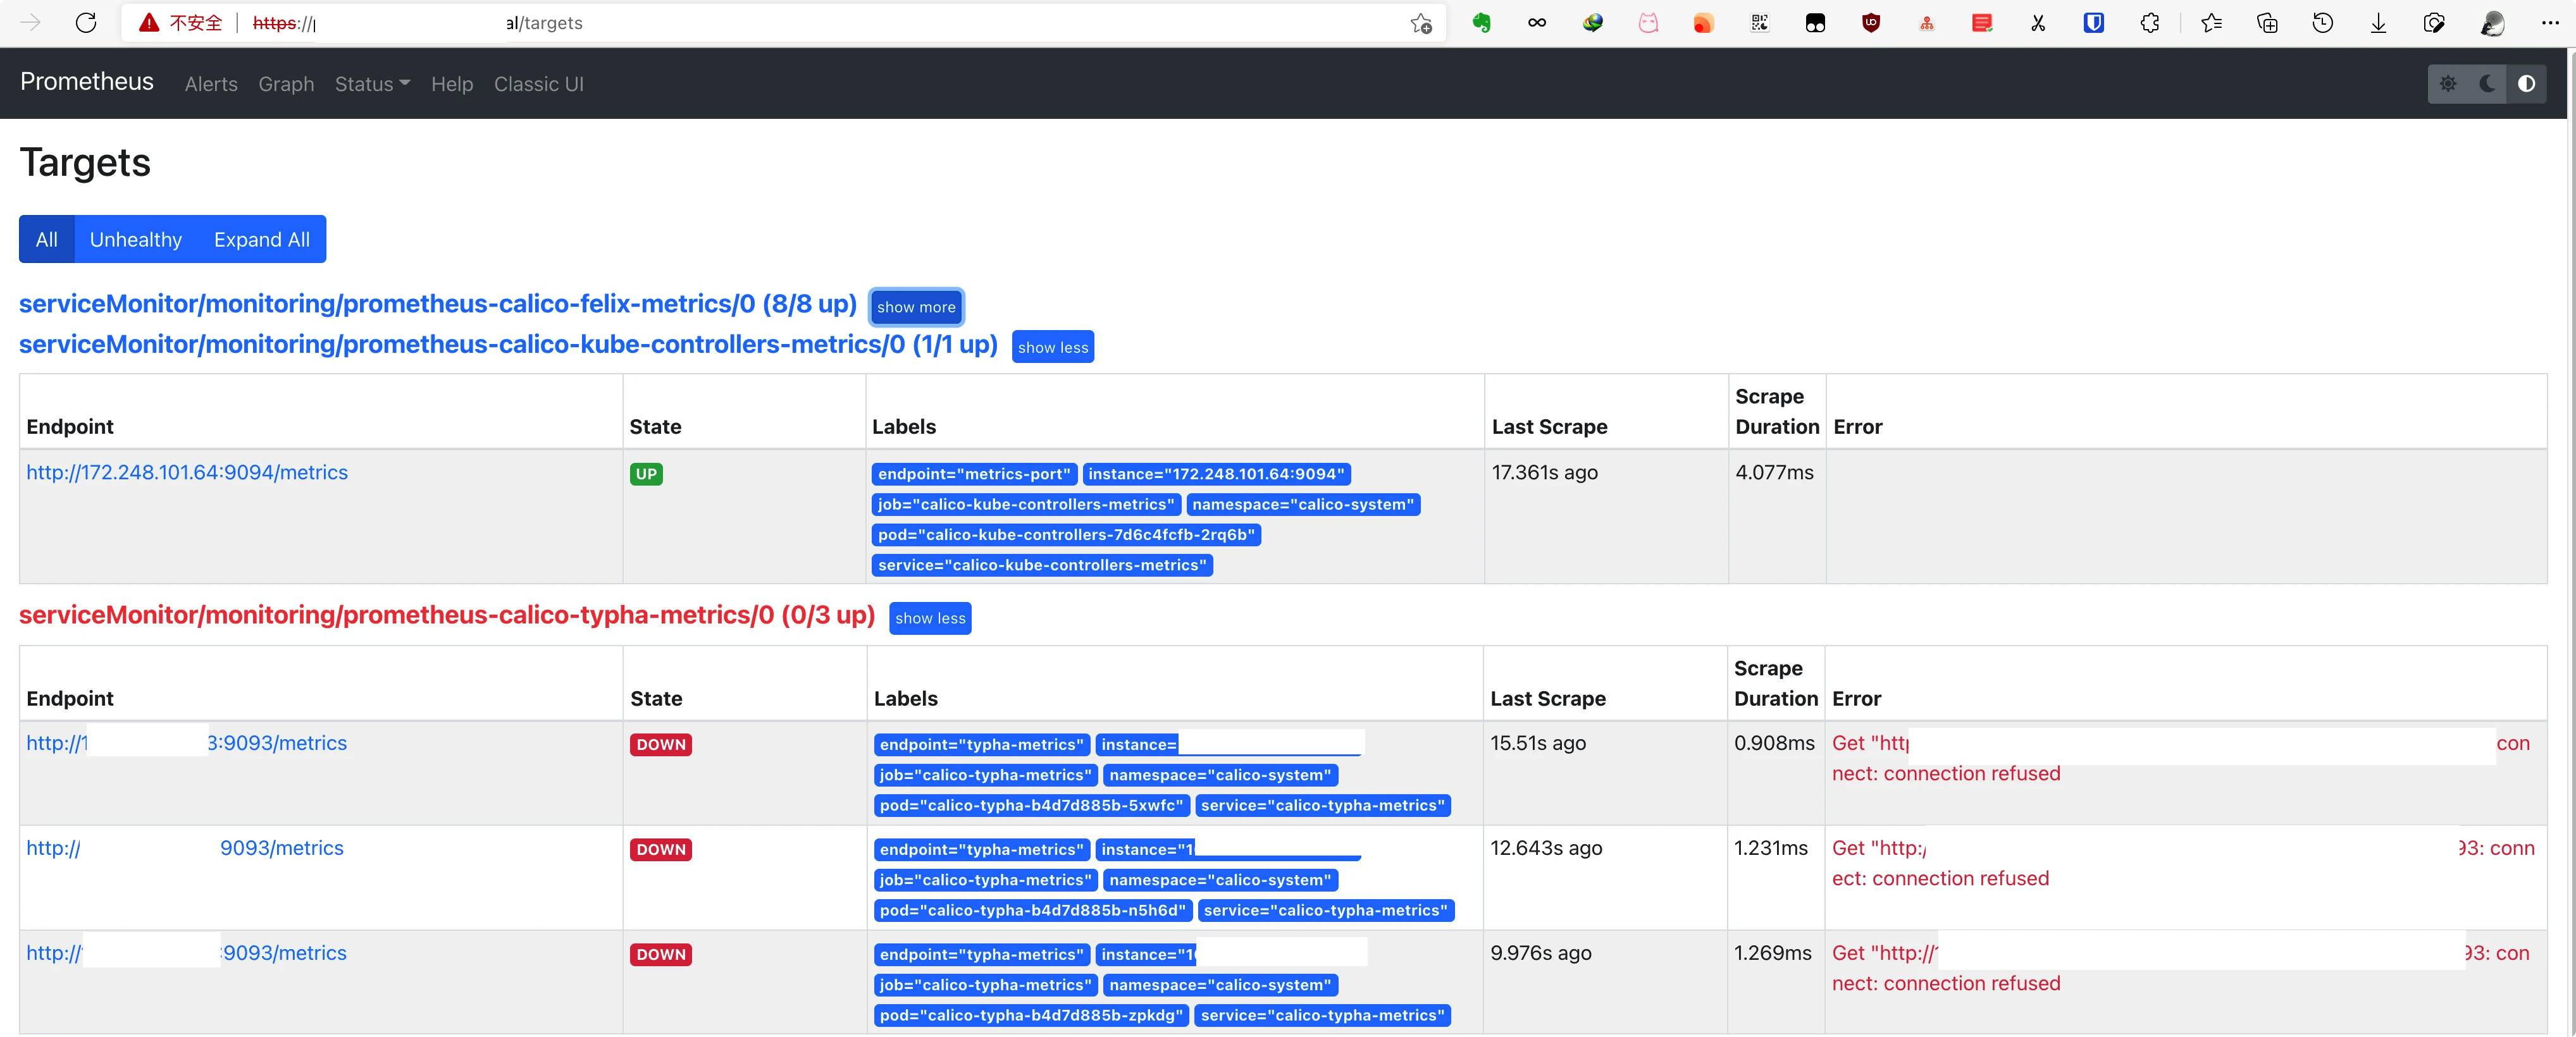
登录 Prometheus dashboard 查看新建的 target 是否正常
3. Grafana 查看
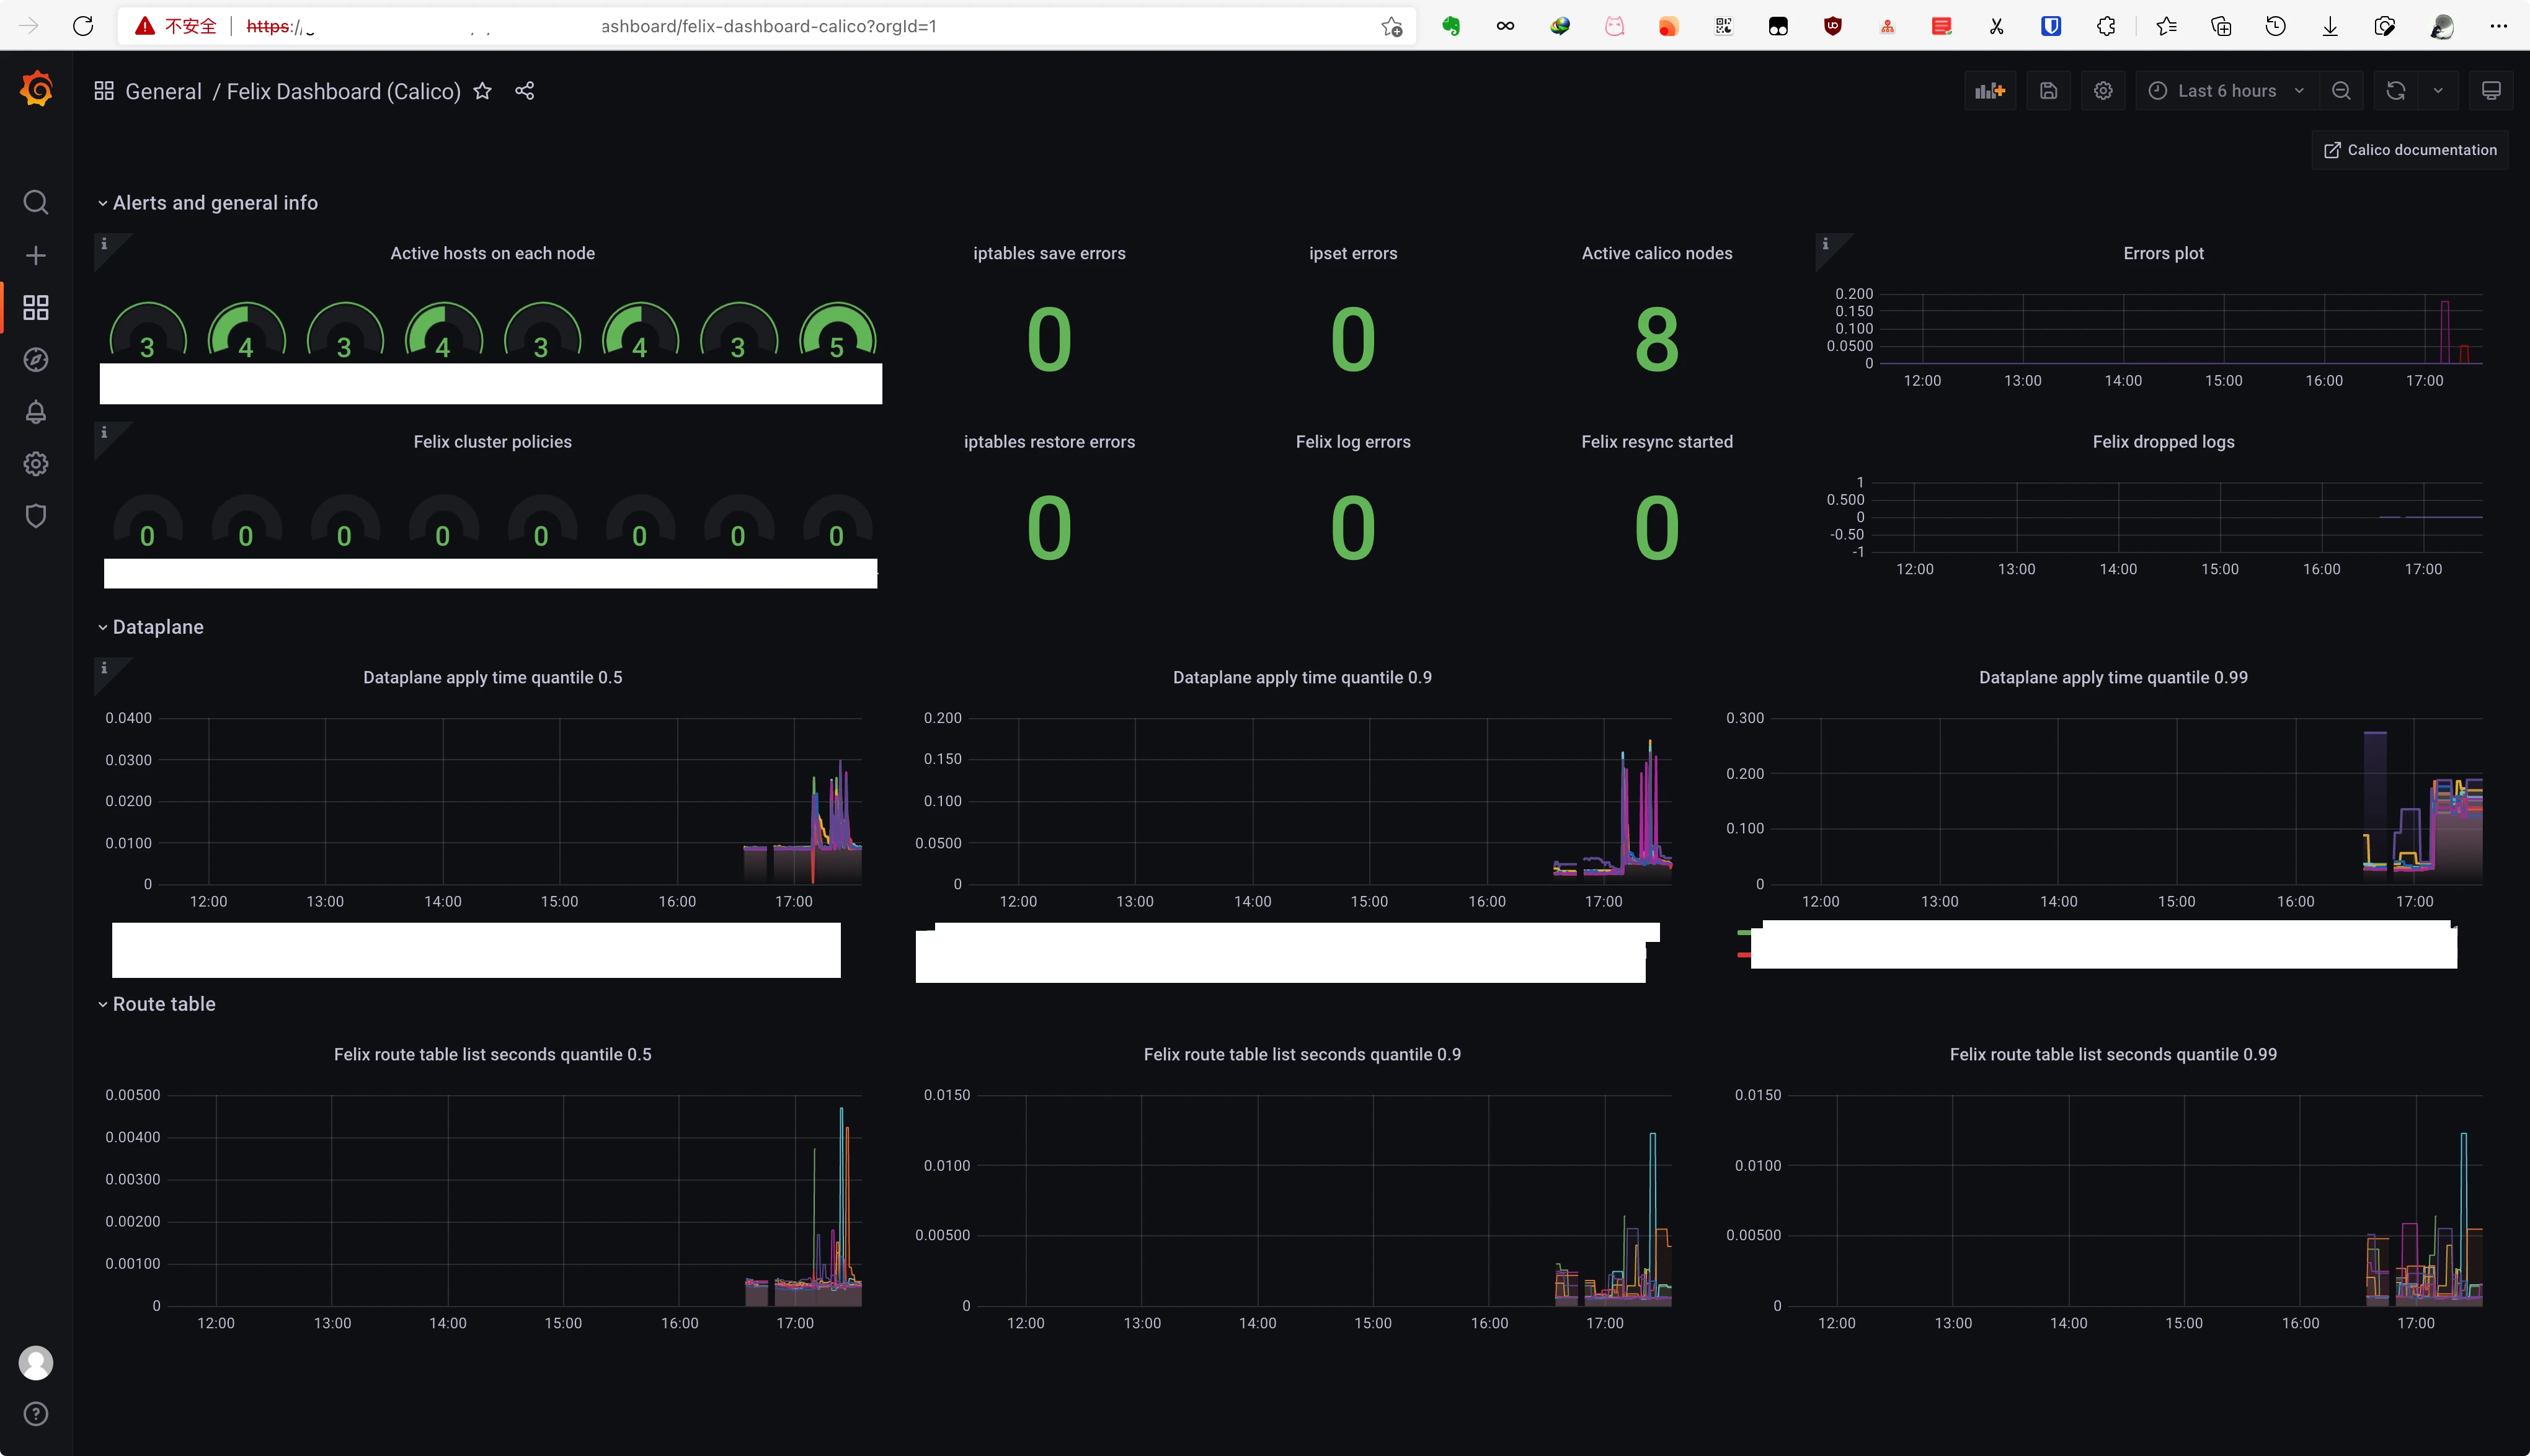
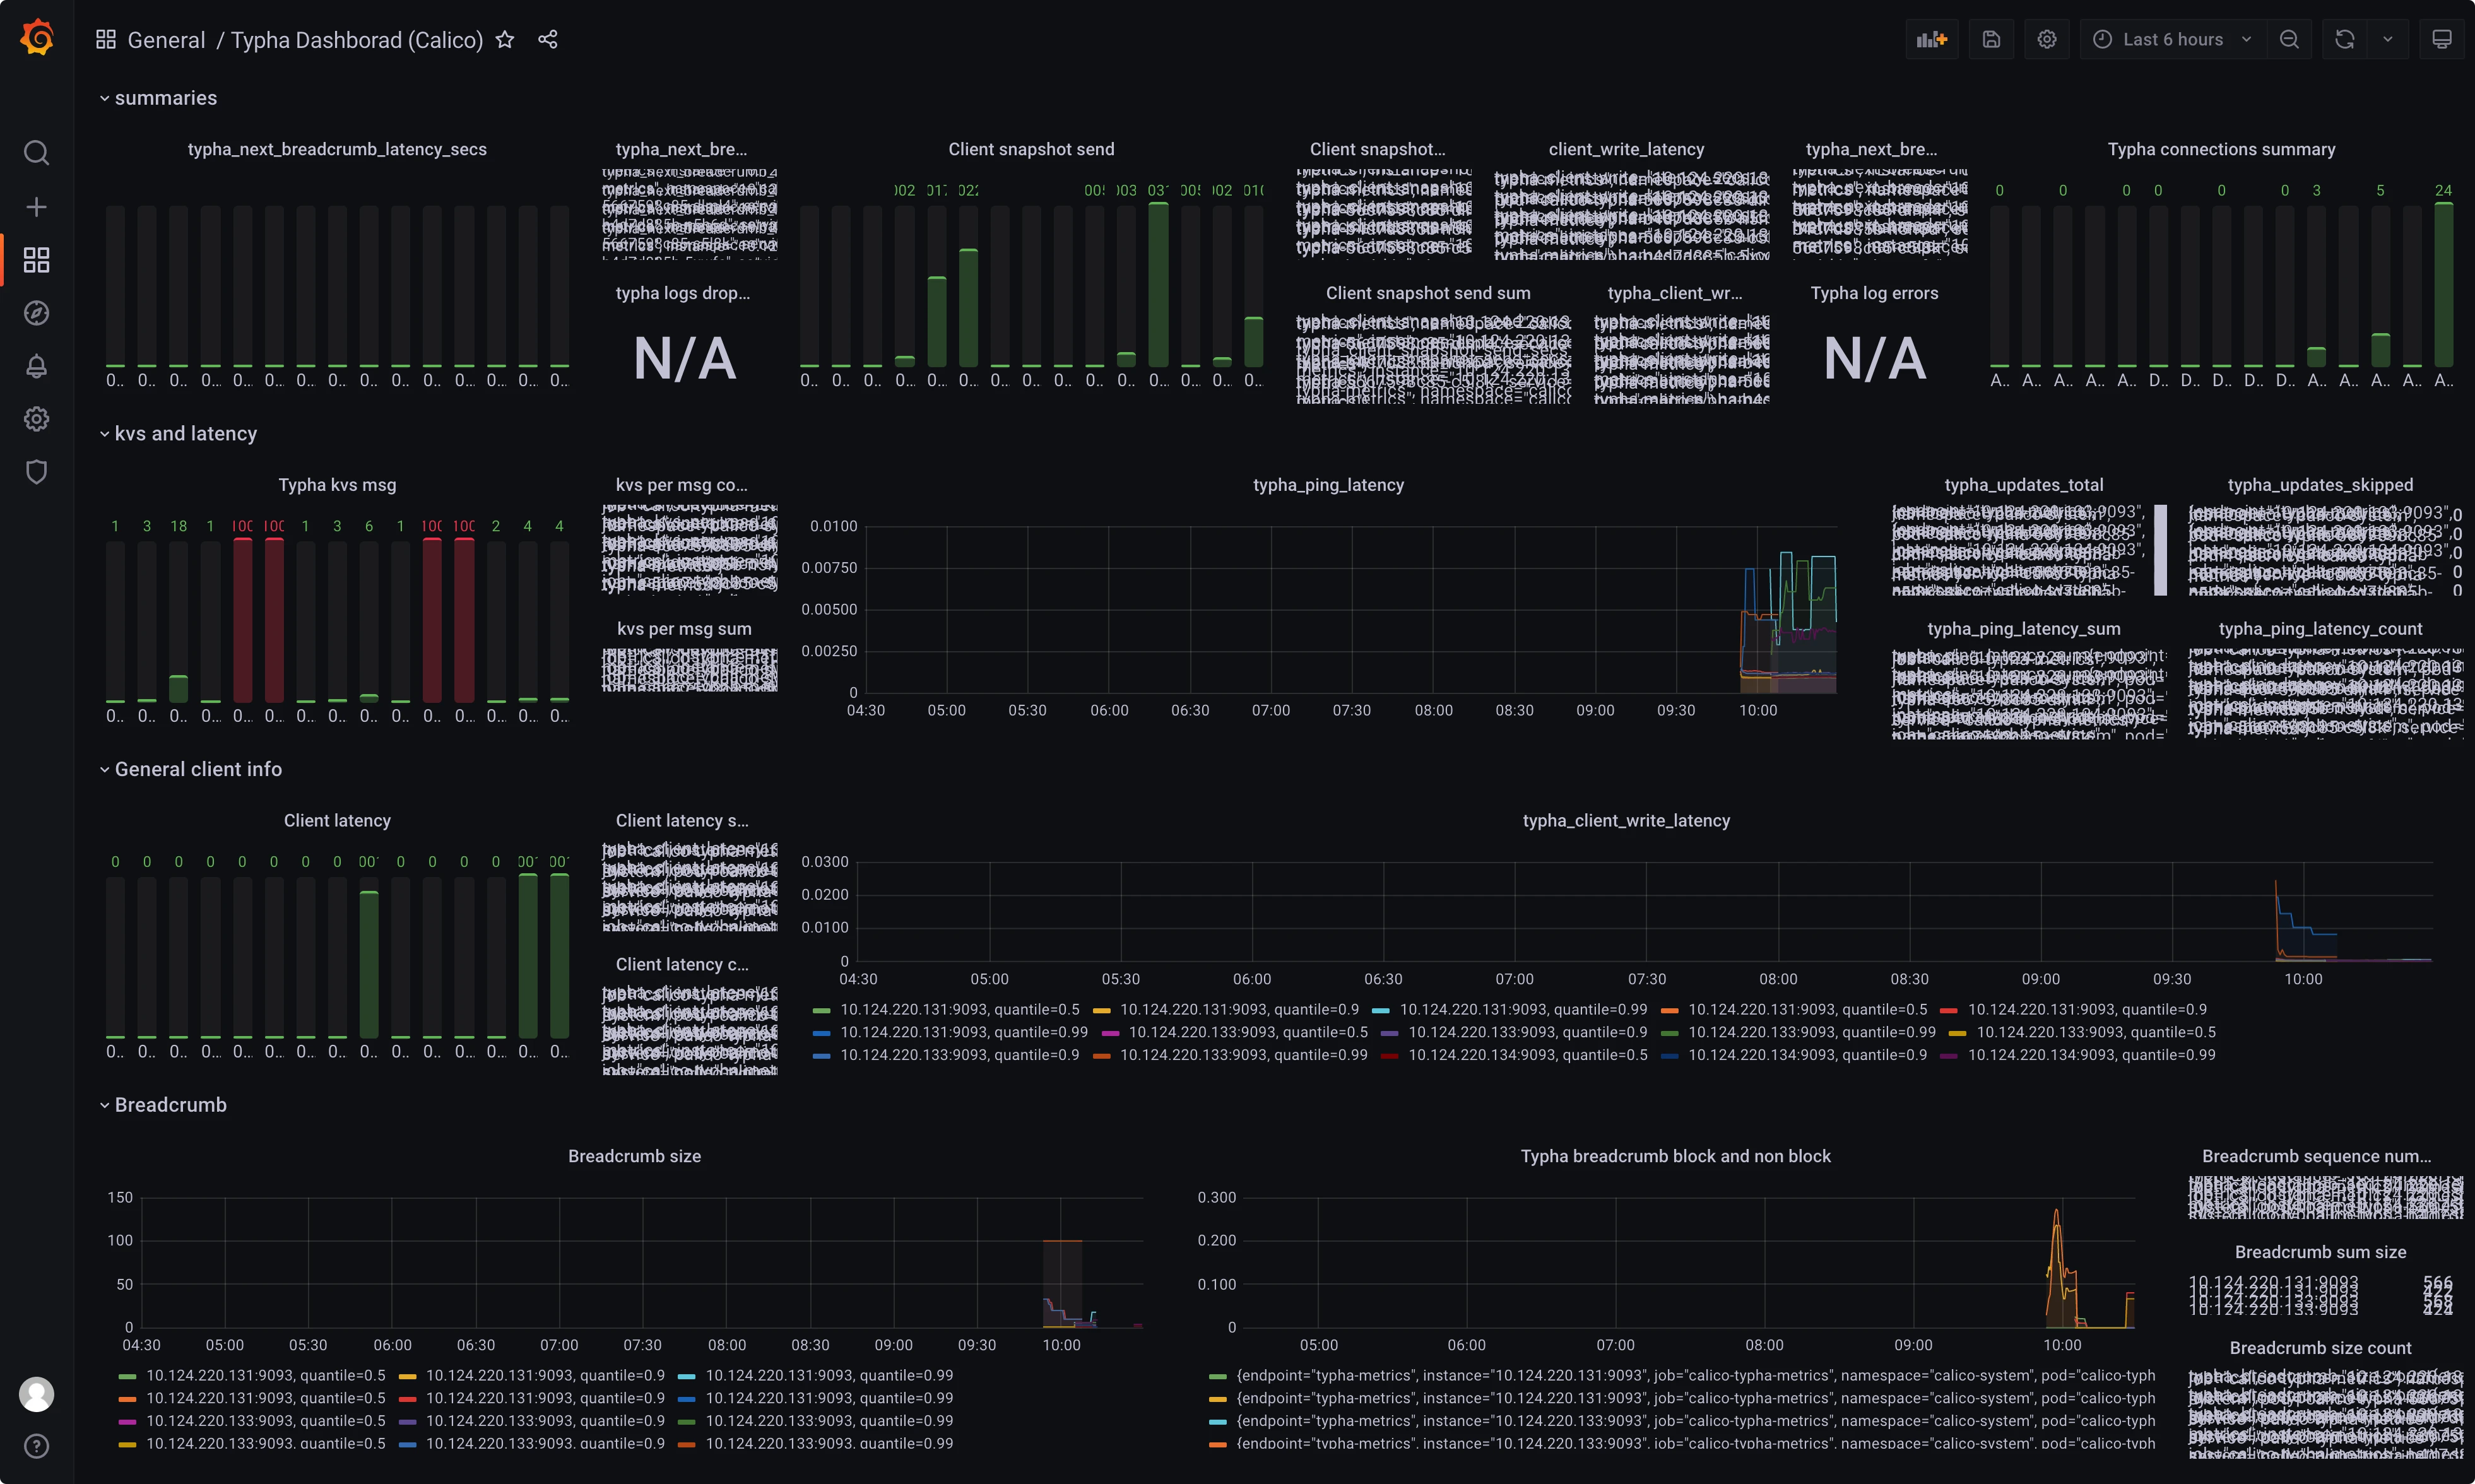
导入 typha-dashboard.json 和 felix-dashboard.json 两个 dashbaord
felix:
 typha:
四、 已知问题
-
在 Typha 配置 中打开了 typha 的 TYPHA_PROMETHEUSMETRICSENABLED 选项,但是一段时间后会被自动重置(如上面的target图)
已经解决,在 custom-resources.yml 中添加 spec.typhaMetricsPort=9091 选项重新应用
-
grafana 暂时没有找到监控 typha 和 calico-kube-controllers 的 dashbaord
已经有Felix 和 typha 的监控 dashboard